Trends in Maternity Care & Outcomes

These indicators enable us to identify trends in maternal characteristics, interventions during labour and birth, maternal adverse outcomes and selected indicators of newborn wellbeing in Australia. The figures below show changes in average rates for selected indicator across all contributing hospitals (undifferentiated by size or service capability levels). Details of rates for individual services and groups of services are available to participating members through our Report Download Portal in our online Members Community.
To access your service’s report log in to the online member’s community and visit the Benchmarking pages.
Maternal Characteristics
In this time series of Maternal Characteristics we can see that the demographics and characteristics for women giving birth at public hospitals in Australia has remained relatively stable over the past 10 or more years.
While individual hospitals may have seen changes in the local population of women they serve, in general across the maternity care sector, the proportion of women having their first baby, of women who are older than 35, older than 40, and/or have a BMI greater than 40 at the time of birth, have remained relatively stable.
The proportion of women giving birth having had a previous primary (first) caesarean section has risen by 14.7% over the past 10 years (from 8.8% in 2011 to 10.1% in 2021).

Care during Labour and Birth
WHA collects a range of indicators related to labour and birth care. The figures below include ‘headline’ indicators that are typically of most interest to service and clinical leaders and to women accessing maternity services.
These data are inclusive of all types of maternity services, from large tertiary teaching hospitals in capital cities caring for many thousands of women each year through to small rural maternity units with fewer than 100 births per annum.
Rates for these indicators for individual hospitals are provided to each participating service, grouped with peer services of similar size and capability. These are aggregated national indicators, included here to give visibility to broad trends in the maternity care sector.


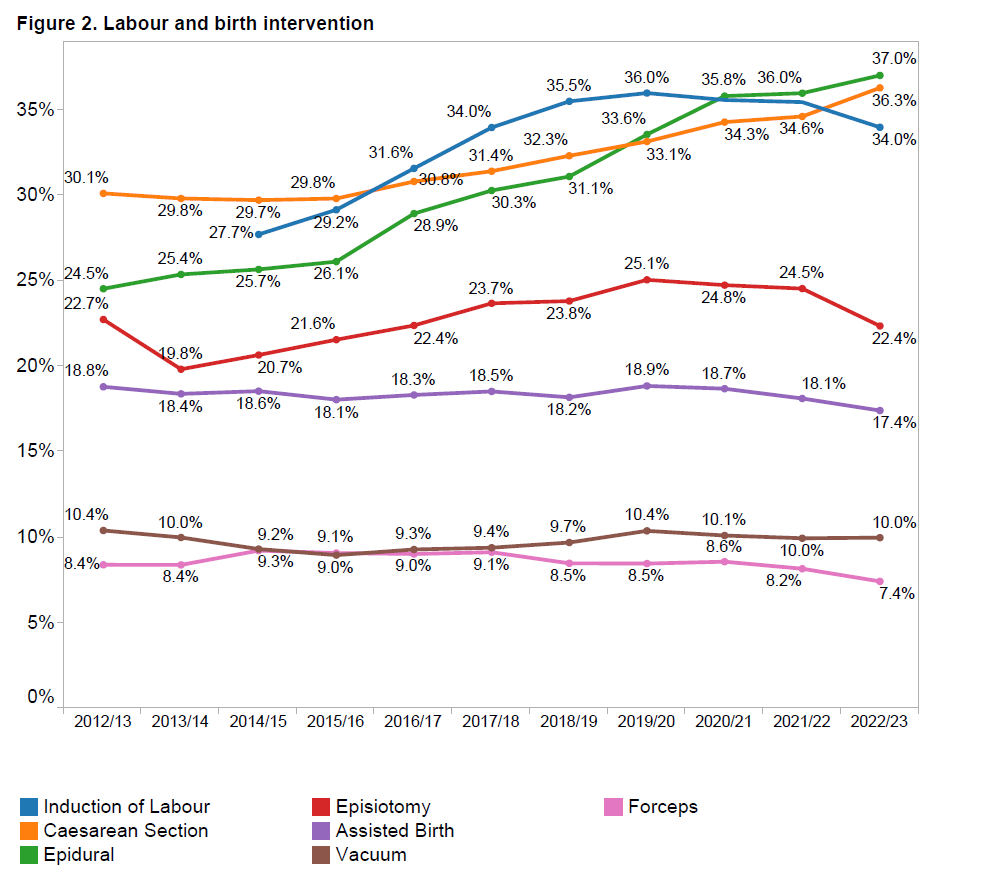
Rates of interventions in labour and birth as reported by member hospitals have measurably increased over the past 10 years (and particularly in the past 5 years):
- Rates of Induction of Labour (blue line) has risen steeply in the past 5-6 years, increasing for all women from 27.7% in 2015 to 35.6% in 2021, as shown in Figure 2). For selected primiparous women (healthy women having their first baby at term) induction of labour has risen from 33.4% in 2015 to 45.1% in 2021, as shown in Figure 3).
- Use of epidural anaesthesia (green line) has increased for all women from 25.7% in 2015 to 36.2% in 2021 (Figure 2) and for selected primiparous women from 29.0% to 35.9% over the same time period (Figure 3).
- Use of episiotomy (red line) has also increased overall from 20.7% in 2015 to 25.4% in 2021 (Figure 2)) and for selected primiparas from 29.6% to 31.9% over the same time period (Figure 3).
- Rates of assisted deliveries (purple line) for both all women and for selected first time mothers have remained relatively unchanged over the past 5-6 years, but with slight variations over time as to in whether ventouse (brown line) or forceps (pink line) were used to assist obstructed births.
- The average rate of caesarean sections (yellow line) across all WHA members has risen for all women from 29.7% in 2015 to 34.5% in 2021, and for ‘selected primparous’ women from 22.5% to 27.7% over the same time period.
As more women experience interventions during their labours and births, so the rate the proportion of women who spontaneously go into labour, and who give birth vaginally without assistance has been declining.

Maternal and Newborn Outcomes
While judicious use of obstetric interventions in labour and birth can dramatically improve clinical outcomes for individual women or babies, these significant changes in clinical care during labour and birth do not appear to be improving collective outcomes for women and newborns, as summarised in Figures 5 and 6.

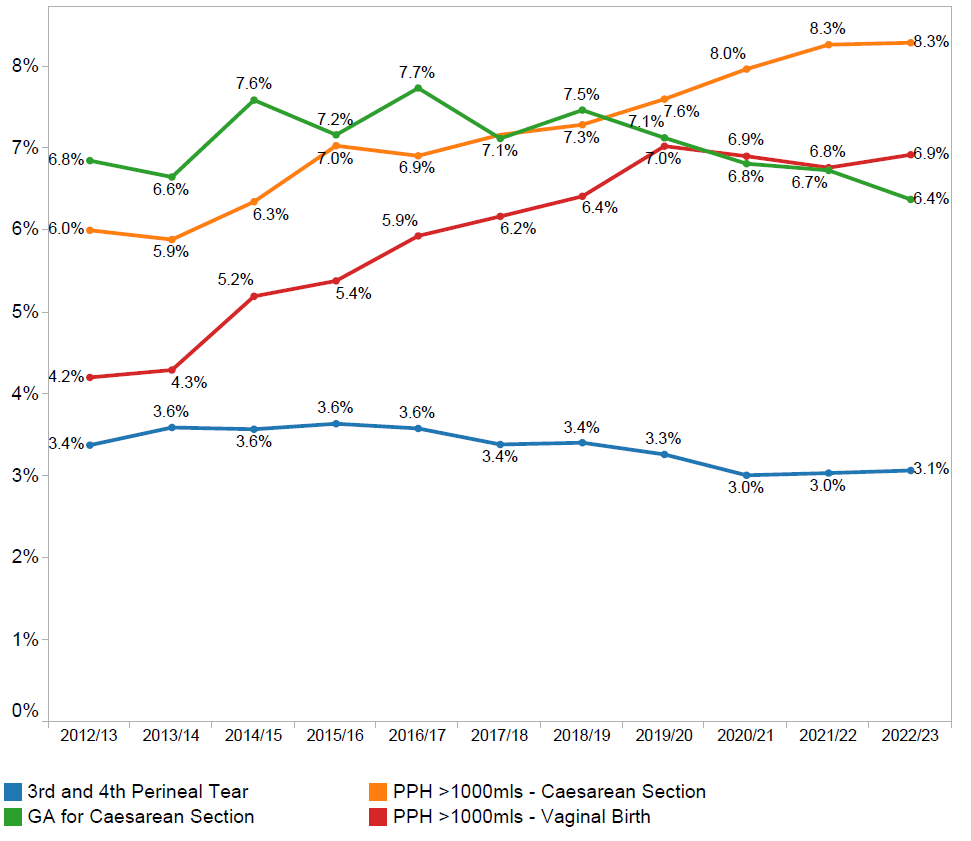
WHA members have collaborated over recent years to reduce rates of perineal harm for women giving birth vaginally, and it is encouraging to see a downward trend in the rates of 3rd and 4th degree perineal tears (blue line), from a high of 3.7% in 2011 to 3.0% in 2020. Efforts to reduce this rate further are continuing.
However there is widespread concern in the sector at present about rising rates of postpartum haemorrhage or PPH (above 1,000mls). Rates of PPH have almost doubled in the past 10 years for women giving birth vaginally (from 3.7% in 2011 to 6.9% in 2021. Rates of PPH have also increased for women giving birth by caesarean sections from 6.6% in 2011 to 7.9% in 2021.
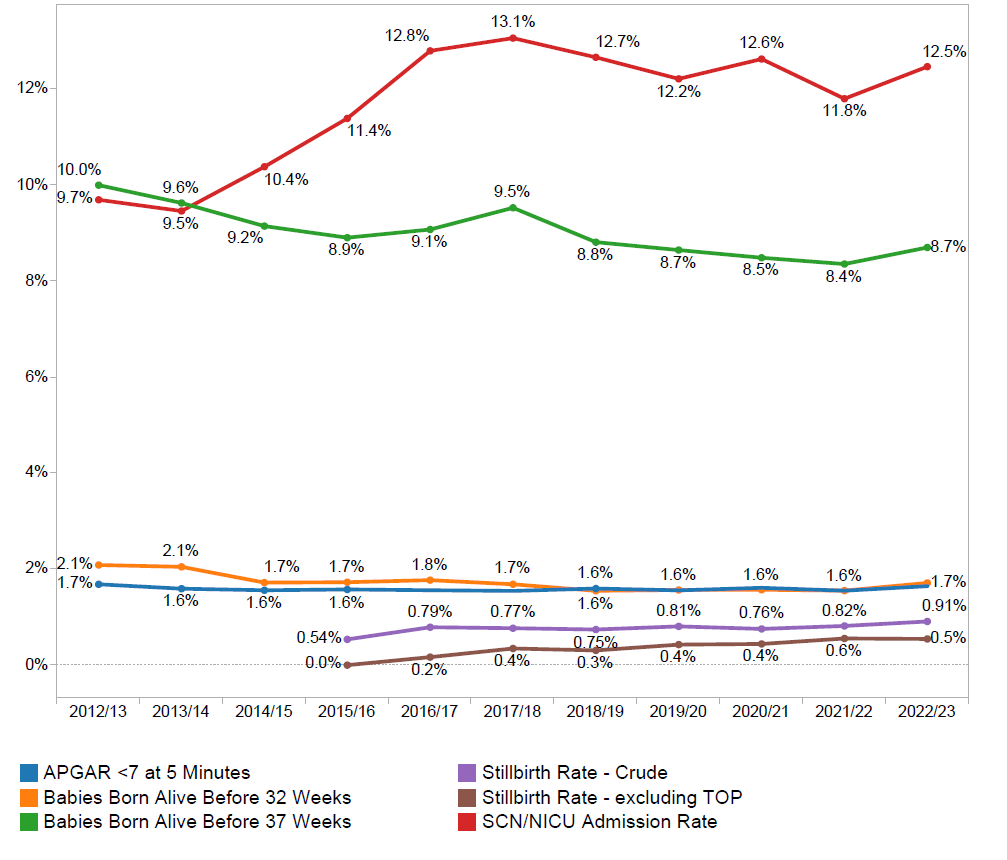
For newborns, there has been encouraging reductions in rates of pre-term births, with a decline in the overall rate of births before 37 weeks gestation from 10.1% in 2011 to 8.8% in 2021 for births before 32 weeks gestation from 2.2% in 2011 to 1.7% in 2021. WHA is hosting a National Collaborative improvement program during 2022-2024 to assist hospitals to further reduce their rates of pre-term birth.
However, there has been no change in the rate of babies whose wellbeing is assessed as being at risk 5 minutes after birth (Apgar score of <7), and many more babies are requiring admission to a Special Care or Intensive Care Nursery following birth (from 10% in 2015 to 12.2% in 2021), with the separation of mothers and babies that entails. Rates of stillbirth after 20 weeks gestation have also remained stable in WHA member services since this indicator was added 4 years ago.

Benchmarking clinical care outcomes with peers is an important tool WHA makes available to maternity services seeking to assess the safety and quality of care provided during labour and birth and changes over time. Benchmarking is, of course, only one tool by which we can assess this. It complements other mechanisms in use at each participating hospital, such as morbidity & mortality reviews, mandatory education programs, and audits of clinical practice. By providing services with an indication of how similar or different their care and outcomes may be with peer services with similar service capabilities caring for similar women, WHA helps participating hospitals to identify the strengths of their service and any areas that may warrant attention for further improvement.
Read more about WHA’s Clinical Maternity Benchmarking Program.


